go应用性能分析工具

一 Go性能调优
Go语言的性能主要是体现在四个方面:
A. CPU profile :报告cpu的使用情况,使用一定频率采集程序在cpu和寄存器上的数据;
B. 内存 profile(heap profile):报告程序内存使用情况;
C. Block profiling: 报告goroutine阻塞,不再运行的情况;用来查找和分析死锁;
D. Groutine profling: 报告goroutine的使用情况,区分调用关系;
常用工具:
runtime/pprof:采集工具型应用的数据;
net/http/pprof:采集服务型应用运行数据信息;
二 工具型应用性能分析(runtime/pprof)
A. CPU分析
1 | import ( |
然后使用 go tool pprof *.pprof 即可进行数据分析
B. 内存分析
1 | f2, err := os.Create("./memory.pprof") |
然后采用 go tool工具分析,默认采用-sample_index=inuse_space, 可以使用inuse_objects查看分配对象数量
三 服务型性能分析(net/http/pprof)
1 |
|
只需要在服务上放导入**_ “net/http/pprof”**即可;
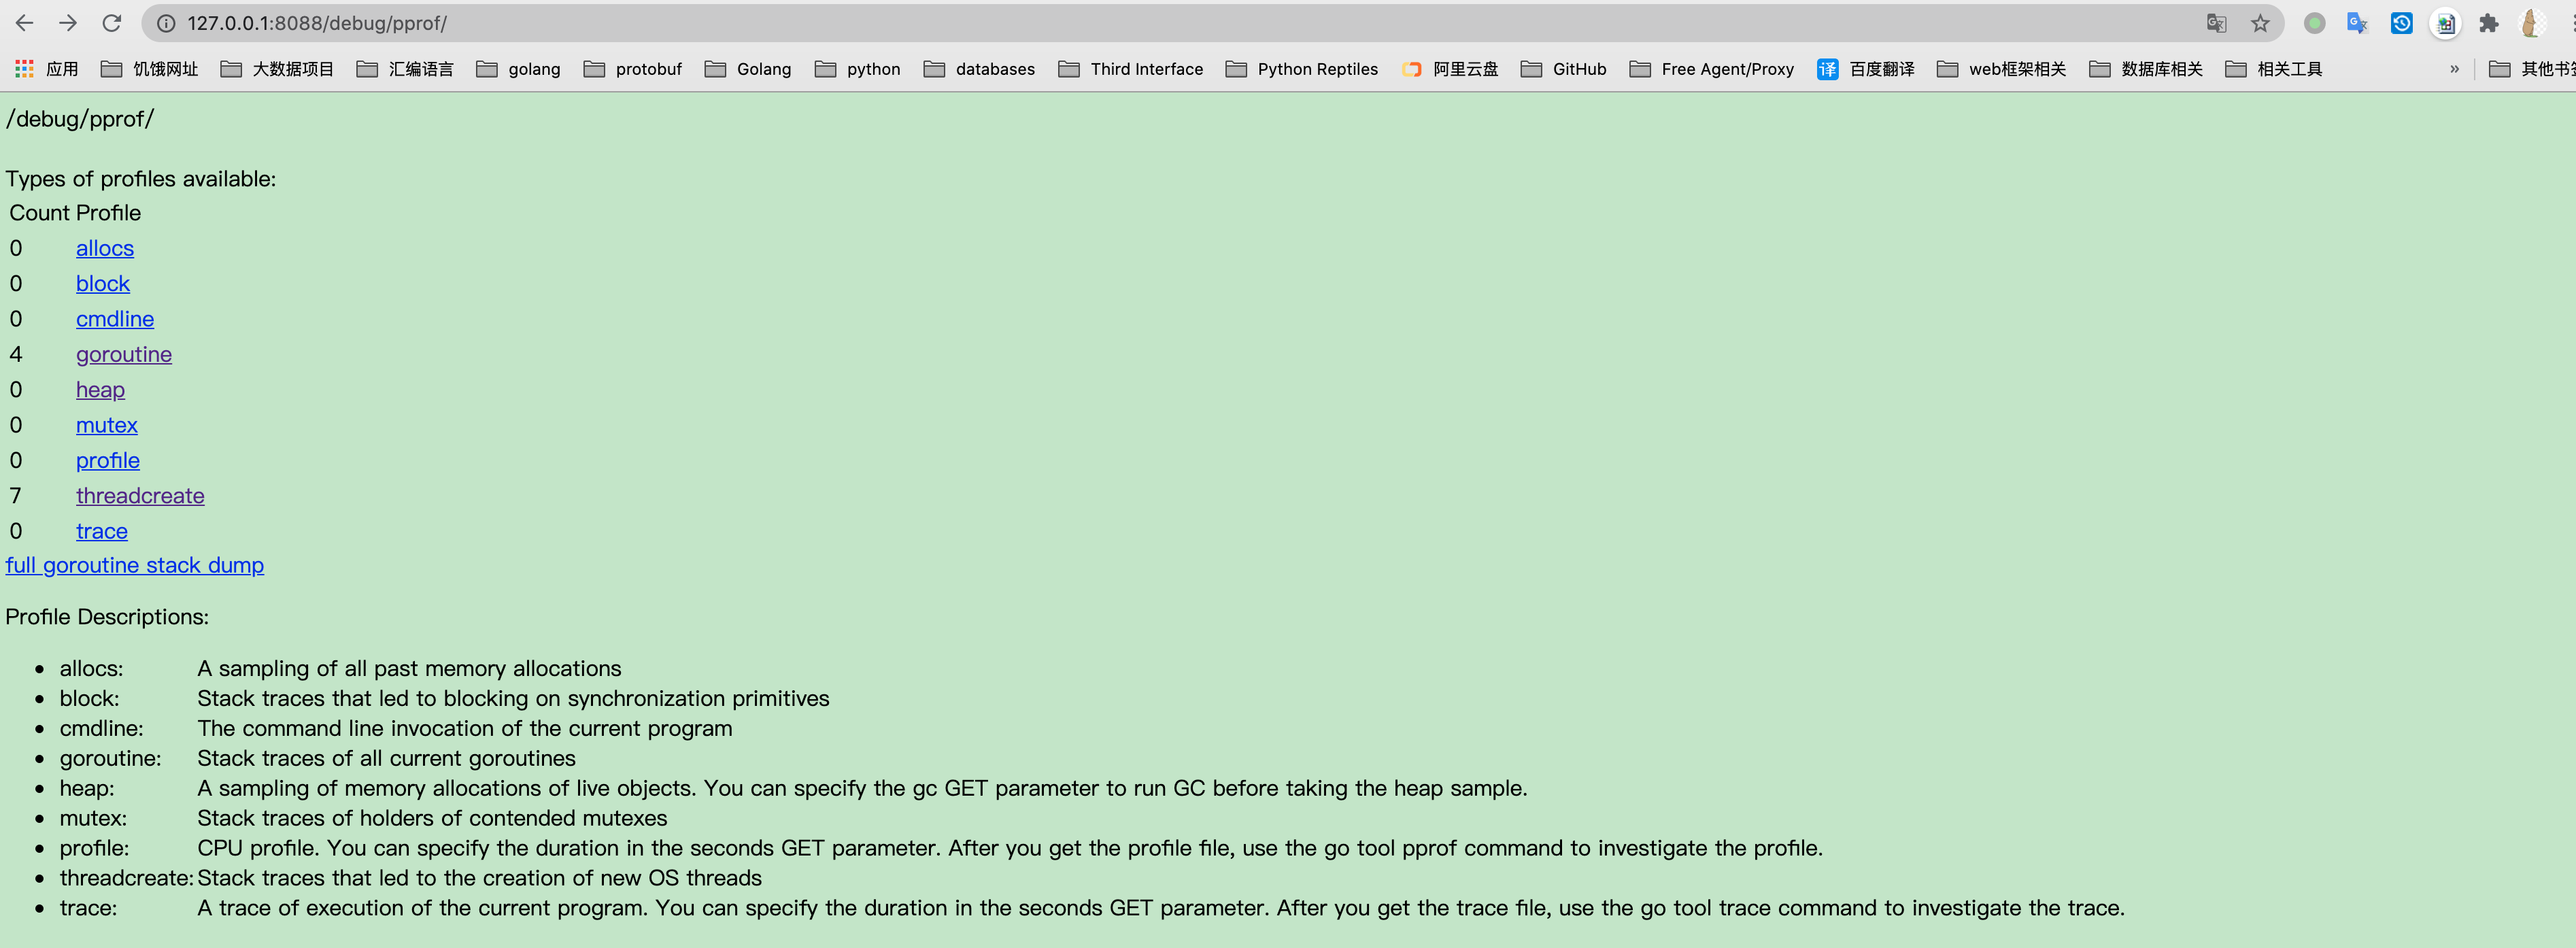
然后在浏览器上访问: Addr/debug/pprof 即可,得到下图:
四 内存使用矢量图查看工具
1 | brew install graphviz |
安装完成后,需要讲其添加到执行文件目录下,通常是/usr/local/bin目录。
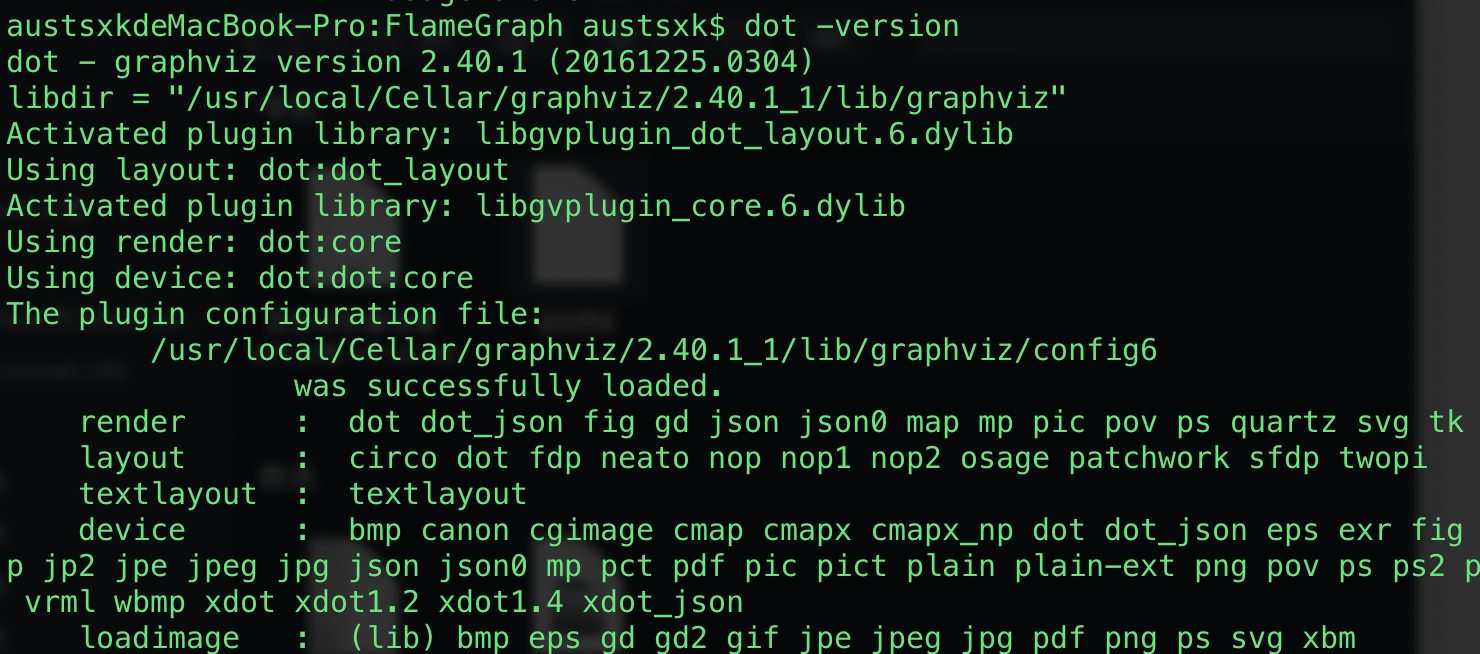
使用 dot -version判断是否安装成功。
在使用 go tool pprof *.pprof 打开交互界面后:

输入web后,将自动保存一个pprof001.svg矢量图。
文件位置:
1 | file:///private/var/folders/g4/40wbk_1d10g7p0g9jsz2t_z40000gn/T/pprof001.svg |
在浏览器中打开如下图所示:
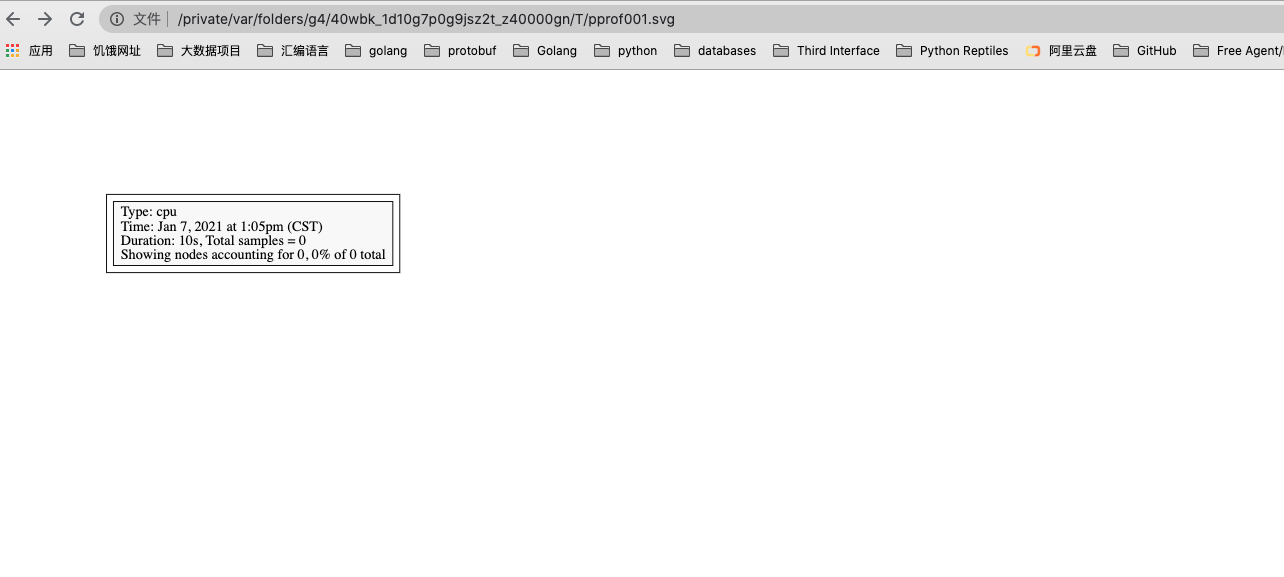
在上述图纸中(没有函数调用):
每个框代表一个函数,理论上框的越大表示占用的CPU资源越多。 方框之间的线条代表函数之间的调用关系。 线条上的数字表示函数调用的次数。 方框中的第一行数字表示当前函数占用CPU的百分比,第二行数字表示当前函数累计占用CPU的百分比。
五 火焰图性能分析
安装FlameGraph,FlameGraph是profile数据的可视化层工具。
1
git clone https://github.com/brendangregg/FlameGraph.git
将应用拷贝在可执行目录下
1
cp ./flamegraph.pl /usr/local/bin
终端测试是否安装成功
1
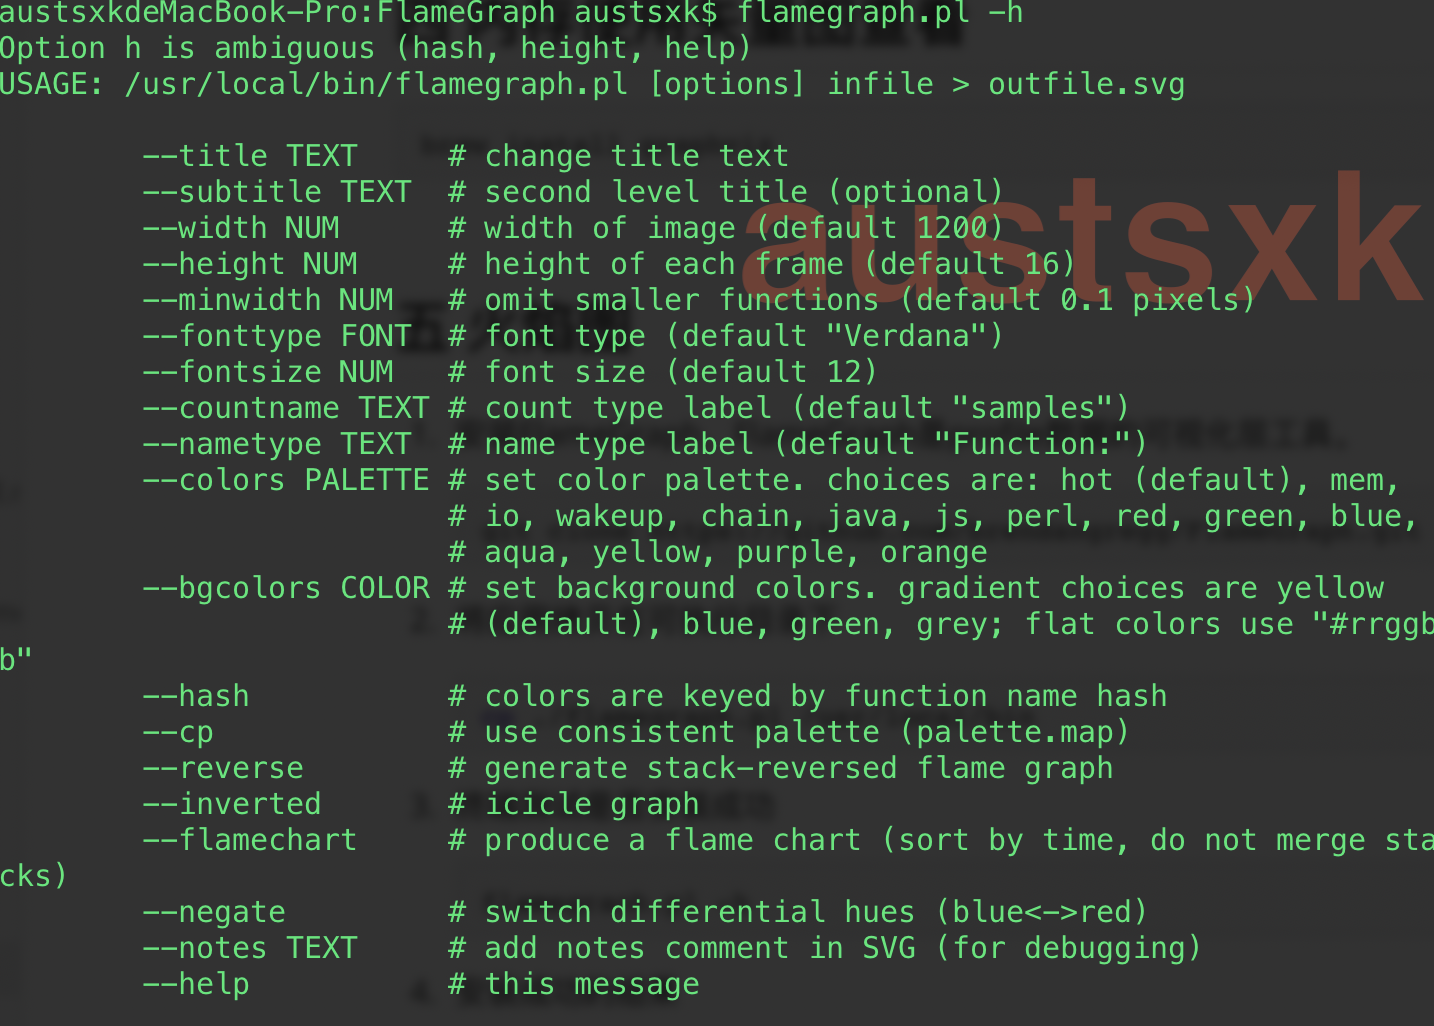
flamegraoh.pl -h
安装成功的结果
安装go-torch,在有framegraph的支持下,安装go-torch展示profile的输出
1
go get -v github.com/uber/go-torch
使用go-torch -h查看是否安装完成
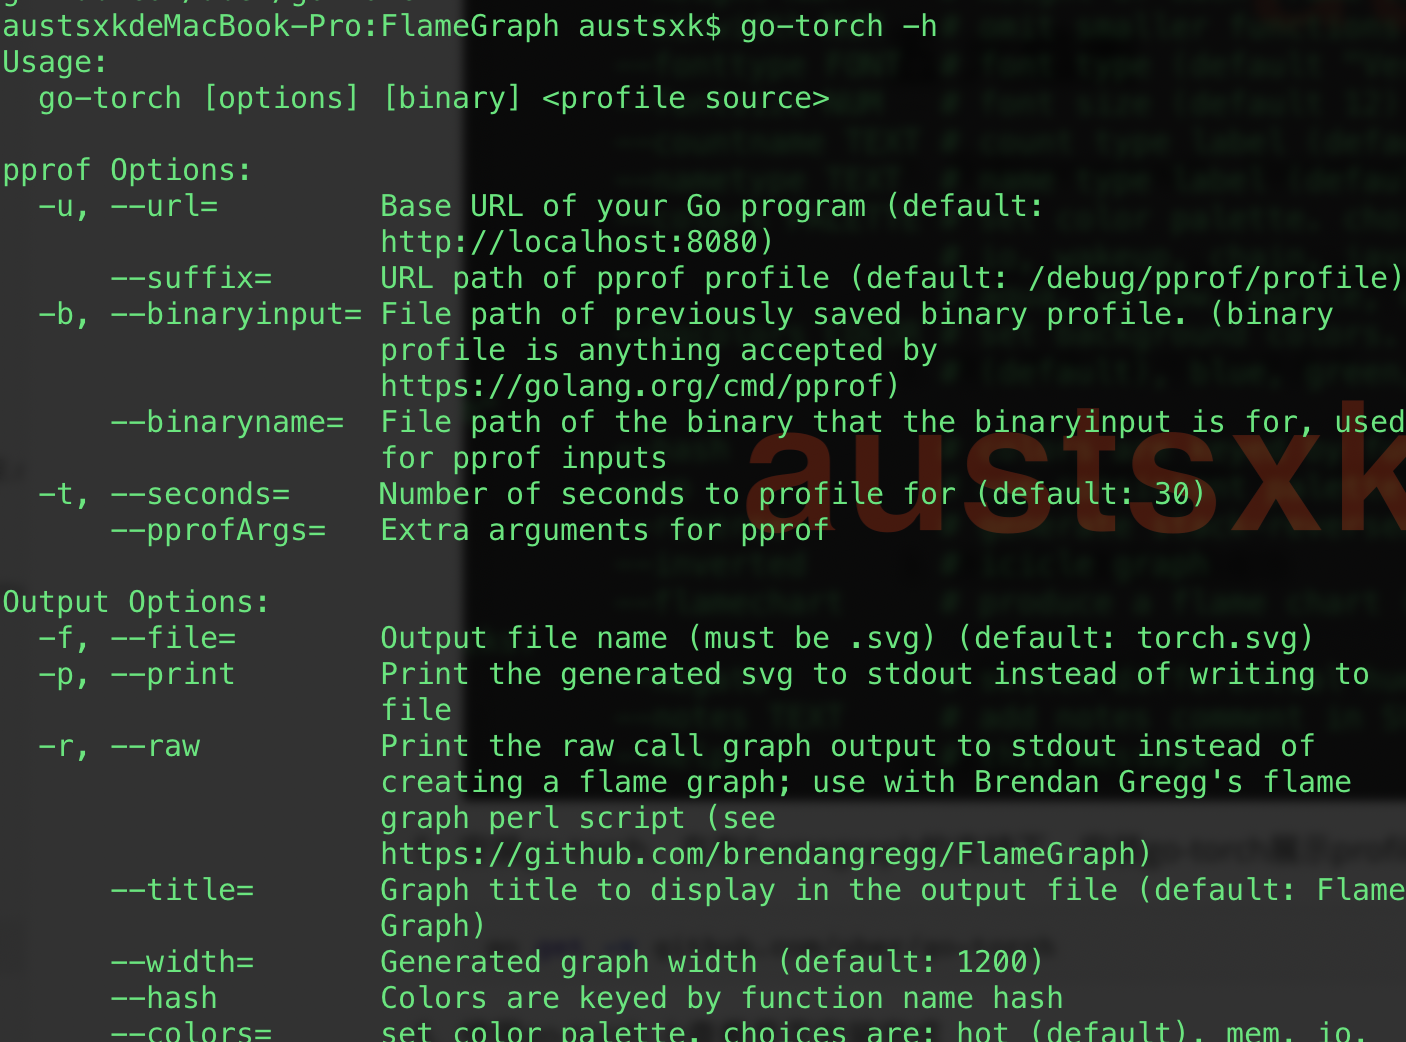
准备压测工具 wrk
1
推荐使用https://github.com/wg/wrk 或 https://github.com/adjust/go-wrk
1
go get -v github.com/adjust/go-wrk
压测使用方法:
1
go-wrk -n 100 http://127.0.0.1:8088/index
结果:

开启go-torch 检查并生成矢量图
1
go-torch -u http://127.0.0.1:8088 -t 30
就是在30秒,生成一个torch.svg矢量图;
参数说明:
-u: 指定访问的url和端口 (-url=)
-s: 指定pprof proflie的存储路径,默认 /debug/pprof/profile
-seconds: 指定profiling监控的时间长度,默认30s
执行结束后,生成torch.svg矢量图
打开火焰图结果如下(右键/打开方式/浏览器打开)

如上图所示:
火焰图的y轴表示cpu调用方法的先后,x轴表示在每个采样调用时间内,方法所占的时间百分比,越宽代表占据cpu时间越多。通过火焰图我们就可以更清楚的找出耗时长的函数调用,然后不断的修正代码,重新采样,不断优化。
六 pprof与性能测试结合
go test命令有两个参数和 pprof 相关,它们分别指定生成的 CPU 和 Memory profiling 保存的文件:
参数1: -cpuprofile:cpu profiling 数据要保存的文件地址
参数2: -memprofile:memory profiling 数据要报文的文件地址
在进行性能测试,可以执行CPU和Mem的profiling,并保存在文件中:
如下:
CPU profiling
1 | go test -bench . -cpuprofile=cpu.prof |
Mem profiling
1 | go test -bench . -memprofile=./mem.prof |


